

If you've lived in Boston long enough, you've encountered the phenomenon of "bar shift". You get to know a restaurant but then something changes. But what? The chef? The vibe? Or, you think as your eyes dart around this once-familiar watering-hole, maybe it's you have changed? For Chris Marstall, creative technologist at the Lab, this moment sparked and idea for a project destined to become our first Lab prototype, BizViz.
The GlobeLab, along with MIT Center For Civic Media fellow Rahul Bharghava, began by researching ways in which people interacted with restaurants digitally. What sort of data would be accessible to help us compile an accurate footprint of a venue?
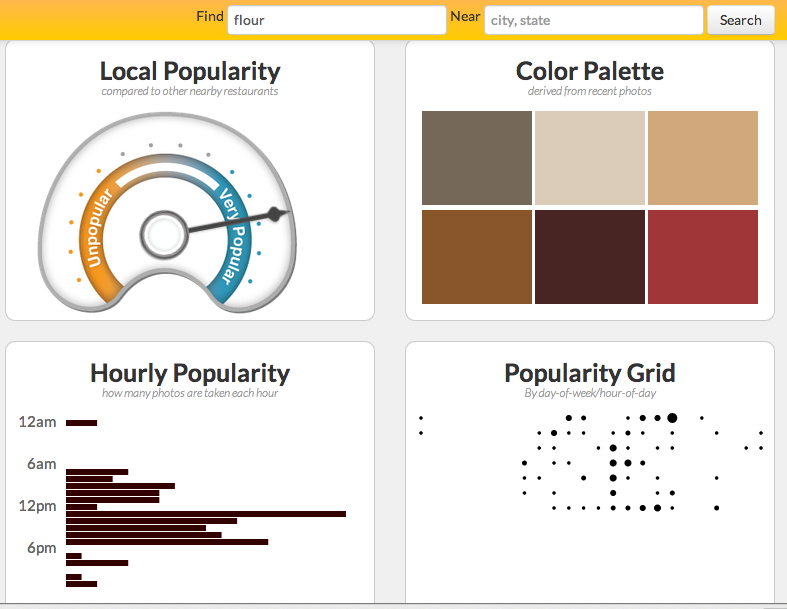
Yelp, Foursquare, and Instagram provided the easiest and most relevant data for our prototype. We used Twitter Bootstrap and D3.js to quickly paint a portraite of the numbers we gathered.
From there, we began taking the blocks and playing Frankenstein. How would our Instagram feed be improved by laying the photos on a timeline? How can we judge popularity of a venue most accurately? How accurate is our data at making educated decisions on popularity?
The blocks shifted into new and novel amalgamations.
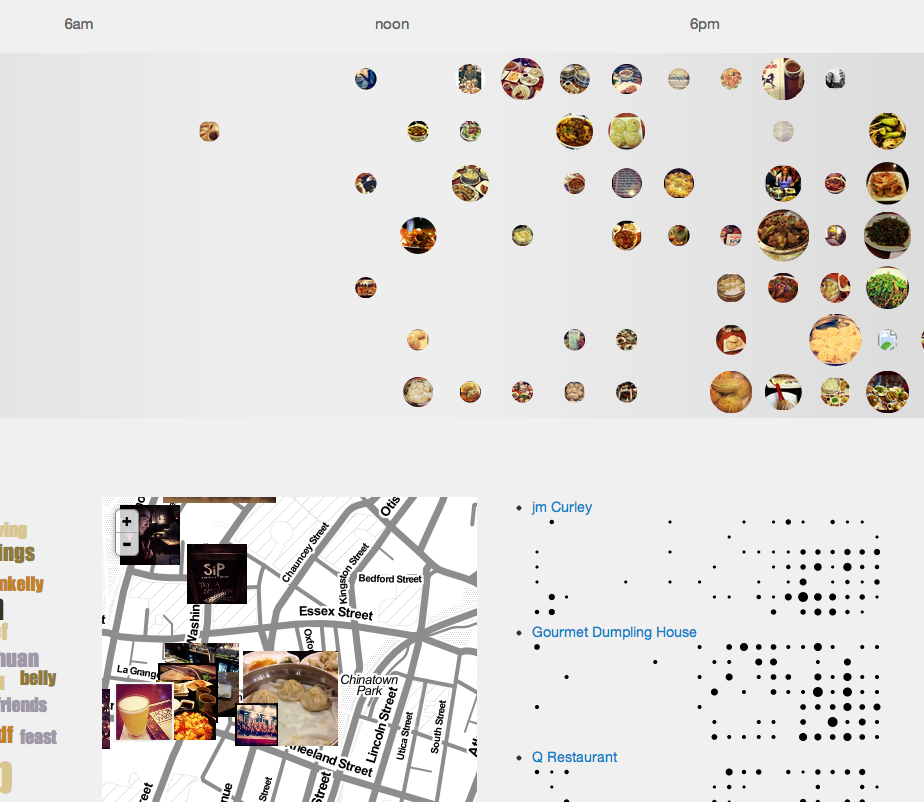
By putting Instagram photos on a timeline, it was much easier to see what time a particular restaurant was the busiest, what people were there for (or at least what they enjoyed photographing the most) and a range of other nuances.
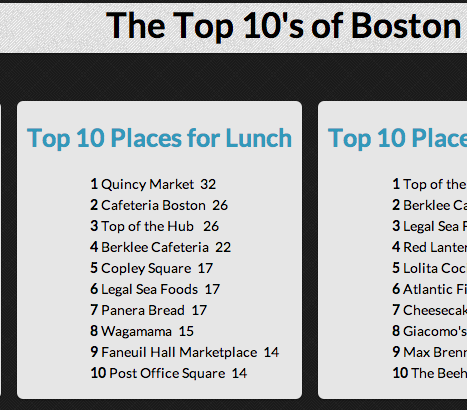
Through word and sentiment analysis, we were also able to construct and series of "Best Of" lists from our data. These lists proved to be more speculative, but sometimes their accuracy was perfect.
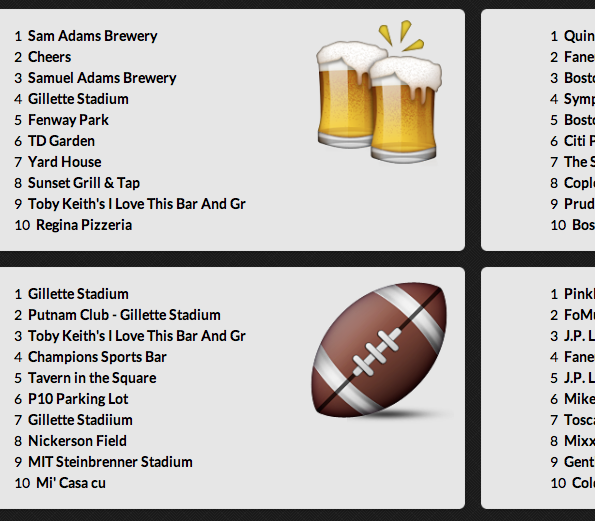
Finally, when we began studying our initial blocks, some emoji were getting mixed into our word cloud signal. Eventually, what started as a nuisance to the coding became it's own list and the result was entertaining. Many of the more widely used emoji (smiling, frowning) weren't very useful, but the very specific emoji (beer, Christmas tree) portrayed a fairly accurate picture (subjectively speaking) to a relevant list of places associated with the pictogram.
But, social media can only provide so much insight. The majority of residents may not be overly active on the sites that we surveyed, or at all. Some of the synthesis insights also don't weight suggestions based on the number of times a phrase or location is mentioned, making is difficult to qualify a list as being decisive. There were several inconsistencies (like a bar in Medford listed #1 in Best Pizza, except it doesn't serve pizza) in the data as well, which eroded our ability to trust the insights.
However, the proof of concept was decidedly successful. In a month, we were able to generate a platform to gather many different data sets and provide users with a clean method for navigating it's pieces in order to make a more educated decision more quickly than by running a multi-platform search for every restaurant they may be interested in trying. If the project were to be released to the public, it would also include richer information gathered from a more inclusive list of sources both within and outside of social media. The project is currently being discussed with several departments in the hopes of implementing some permutation of its original vision somewhere within Boston.com.